
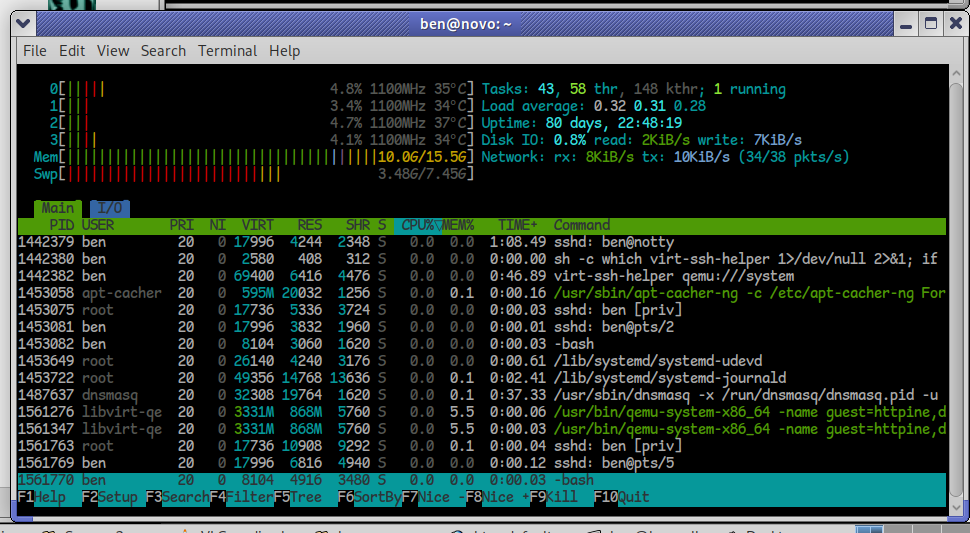
I’d like to take a moment to explain a handy feature of htop, a system monitoring and process management tool — basically a text-based “Task Manager,” but far more powerful and flexible. I run it on my desktops, laptops, servers, and occasionally on virtual machines, whether in a graphical session or a terminal-only environment. Below, you’ll see it running on my server, where I’ve configured it to display the frequency of each CPU core, temperatures, total disk I/O, and total network I/O. As you can tell, activity is minimal — not much happening at this early hour, around 7 AM, when both local and internet traffic tend to be quiet.
htop is a brilliant little utility that punches way above its weight. It’s lightweight, packed with functionality, and refreshingly easy to use. Better yet, there are hardly any dependencies required, and it’s so cleanly written that even a novice should have little trouble building it from source, should they desire to do so. Remarkably portable, htop will compile on just about any Linux system, any of the BSD variants, macOS, Solaris and illumos derivatives, Haiku, and Cygwin (Windows). I think you get the point.
One handy but often overlooked feature is that htop can remember your custom display settings. Whether you prefer to see CPU frequencies, temperatures, disk I/O, or network traffic meters — you can tailor your view exactly how you like it.
Once you’ve customized your layout (press F2 in htop to access the Setup menu), simply press capital S (Shift + s) to save your settings. The next time you launch htop, it’ll load up your preferred view automatically.